The dashboard is the central entry point in social posters. Here users get an overview of the most important activities, results and status reports of their social media posts. It serves as a control center to analyze the performance of the contributions and identify possible problems early on.
1.1 Statistics on posted posts
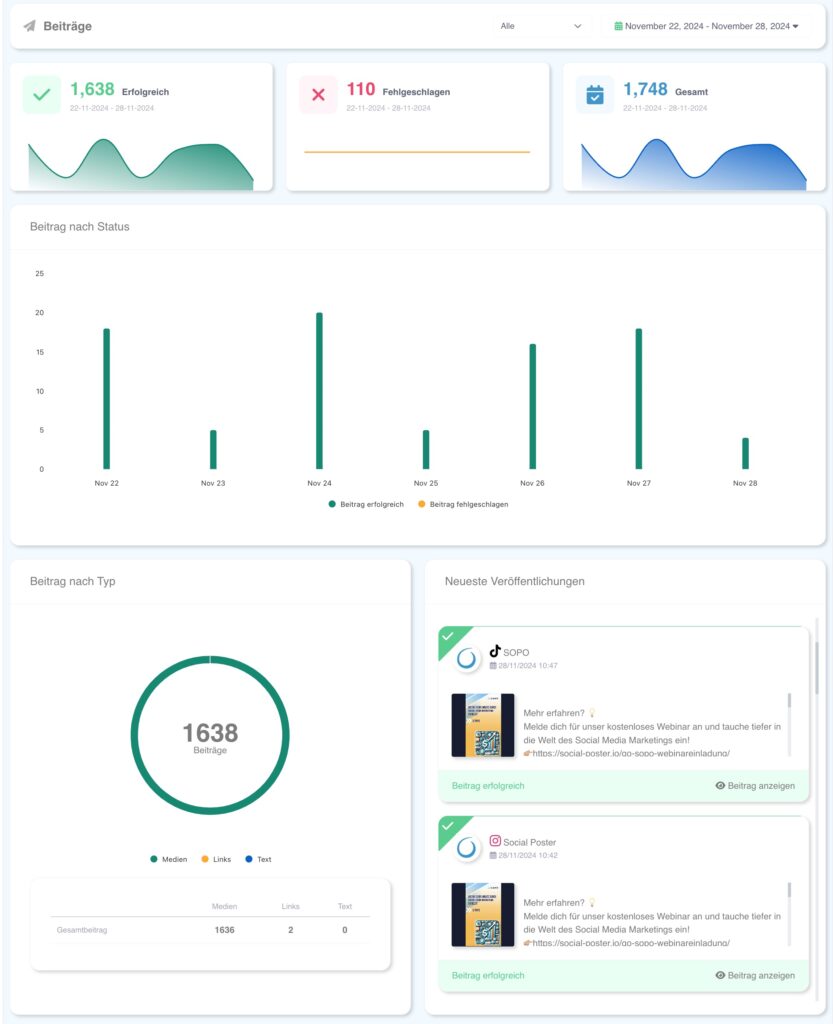
- Description:
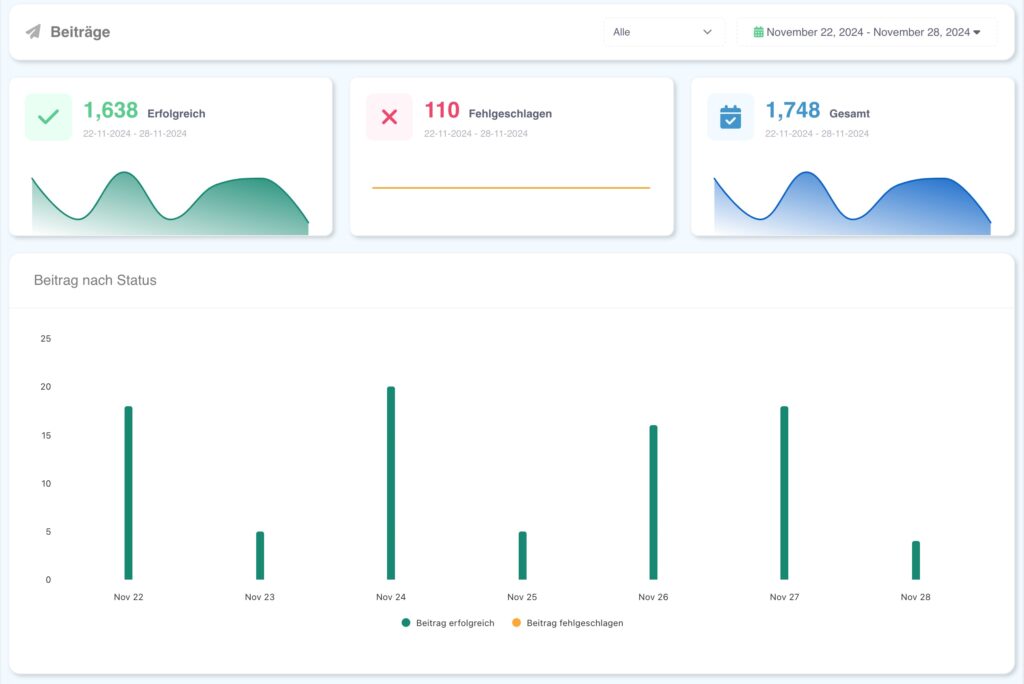
- At the top of the dashboard, statistics on all published posts are displayed.
- Divided into successful and failed posts.
- Representation:
- Bar or cake charts that provide a quick overview.
- Color coding: e.g. B. Green for successful and orange for failed posts.
- Usage:
- Users can see at a glance whether posts have been published correctly or if there were technical problems.
1.2 Posts
- Description:
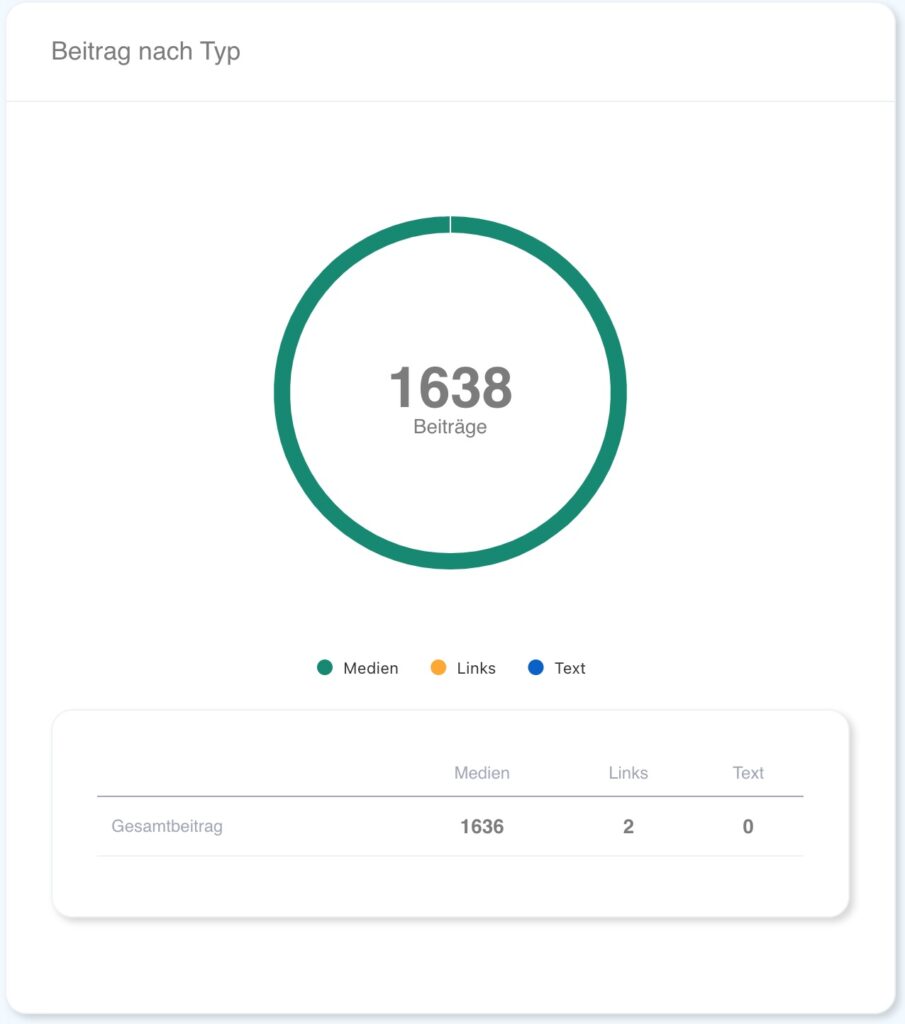
- Posts are categorized by type:
- Media post(Pictures/videos)
- Linkpost(Post with URL)
- Textpost(Only text, no media)
- The number of types is displayed graphically.
- Posts are categorized by type:
- Benefits:
- Analyze which type of post is used the most often and if it matches your social media strategy.
- Recognize patterns: Do certain post types work better than others?
1.3 Current posts
- Description:
- A list of recent posts appears directly in the dashboard.
- Basic information is presented for each post:
- Platform (e.g. B. Facebook, Instagram)
- Date and time of publication
- Status (successful/failored)
- Functions:
- Practical benefits:
- Click on the post: Direct forwarding to the respective social media platform.
- Enables quick feedback from the overview.
1.4 Failured posts
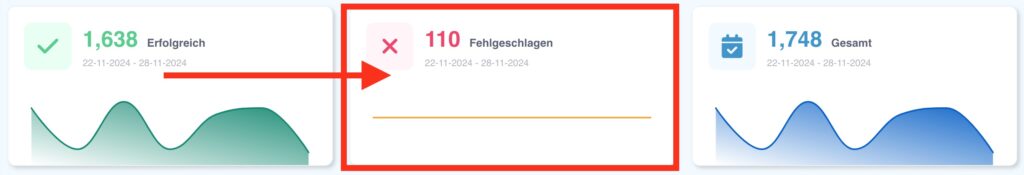
- Description:
- A section that lists posts with problems.
- Common reasons for errors:
- Expired social media connections.
- Exceeding platform limits (e.g. B. character limitation).
- Wrong formats for images or videos.
- Functions:
- Click on a failed post: Display the error message.
- Possibility of processing and re-planning directly from the
- Benefits:
- Detect and fix errors before they impact social media campaigns.
1.5 Filters and adjustments
- Description:
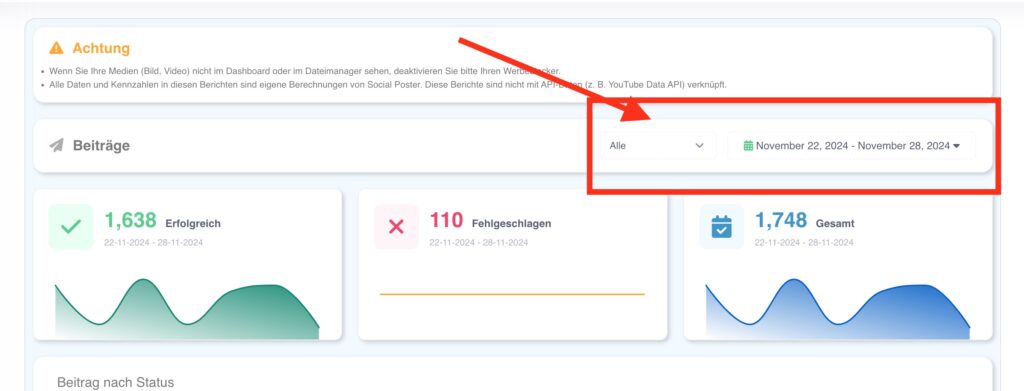
- In the dashboard, filters can be applied to specific
View information:- By platform (e.g. B. Only Facebook, Instagram).
- After periods (e.g. B. last week, last month).
- By group (when multiple clients or projects are managed).
- In the dashboard, filters can be applied to specific
- Benefits:
- Individual customization to see only relevant information.
- Time savings through targeted analysis.
1.6 Overall overview of performance
- Description:
- Summarizing key figures across all platforms:
- Total number of published posts.
- Success rate in percent.
- Frequency of posts per week/month.
- Summarizing key figures across all platforms:
- Benefits:
- Provides a quick overview of whether the posting strategy works.
- Enables easy control of success and strategy adaptation.
Tips for using the dashboard
- Regular control:Check the dashboard at least once a week to detect issues early.
- Understand statistics:Pay attention to how different post types and platforms impact your overall performance.
- Optimize automation:Analyze failed posts to further improve planning and automation.
The dashboard thus provides a comprehensive and interactive overview of the most important aspects of your social media activities. It is the first step to data-driven optimization of your campaigns and an indispensable tool for efficient social media marketing.
Schreibe einen Kommentar